Tags: NamicSoft Portal | Template Design
Welcome to the guide on effectively utilizing the ‘Pie-chart’ Content Control within your NamicSoft templates. This feature is perfect for visually representing data proportions in a clear, engaging manner.
Step 1: Copy the ‘Pie-chart’ Content Control
- Locating the Control: Open the template named ‘Content control pie chart,’ included in NamicSoft. This template features the ‘Pie-chart’ Content Control, optimized for graphical data presentation.
- Copying the Control: Find and select the entire ‘Pie-chart’ Content Control in the template, then copy it. Paste this control into your desired report template in NamicSoft, preparing it for data linkage and customization.
Step 2: Configure the Data Source and Chart Layout
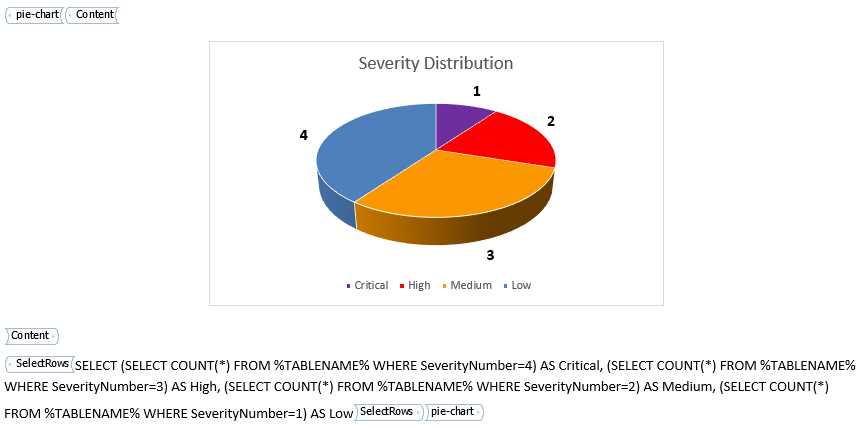
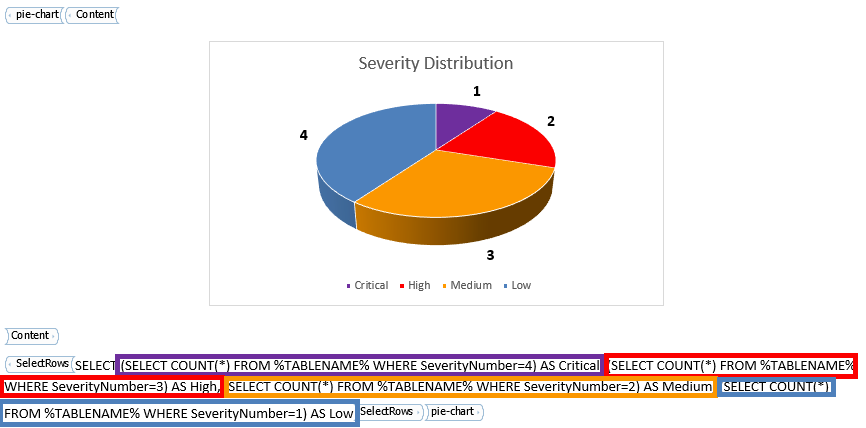
- Setting Up the Data Source: The ‘Pie-chart’ Content Control requires an SQLite query to be set up within the control. This query should return one row of data, with each column representing a different slice of the pie chart.
- Customizing the Layout: Modify the pie chart to fit your report’s needs. This includes adjusting the size, setting up the color scheme for different slices, and adding labels or legends to enhance understanding and readability.
Step 3: Customize the Charts’s Appearance
- Styling the Chart: Tailor the pie chart’s appearance to align with the aesthetic of your report. Adjust aspects like slice colors and the chart size for better visibility. Text labels and legends can also be formatted for clarity and to provide context to the data shown


