Tags: NamicSoft Portal | Template Design
elcome to our guide on utilizing the ‘Bar Chart’ Content Control within NamicSoft templates. This feature enables you to transform numerical data into visually appealing bar charts, enhancing the interpretability and impact of your reports.
Step 1: Copy the ‘Bar-chart’ Content Control
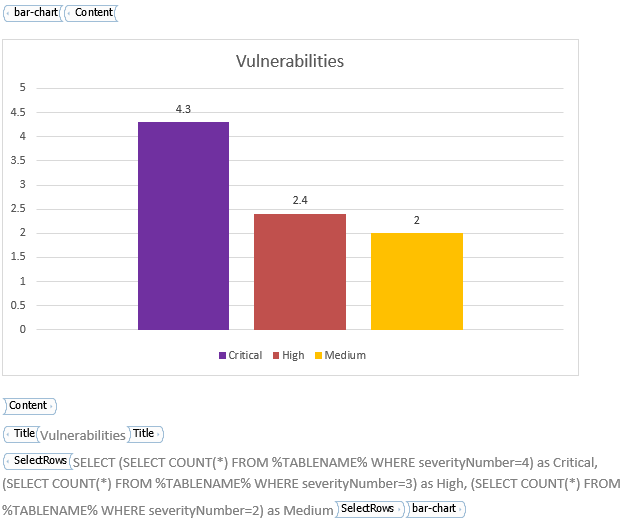
- Locating the Control: Start by opening the template named ‘Content control bar chart’, which is included with NamicSoft. This template features the pre-designed ‘Bar-chart’ Content Control, ready for use in your reports.
- Copying the Control: Once you have the template open, locate the ‘Bar-chart’ Content Control. Carefully select this control, ensuring you include all its components, and copy it, and paste it into your template.
Step 2: Configure the Data Source and Chart Layout
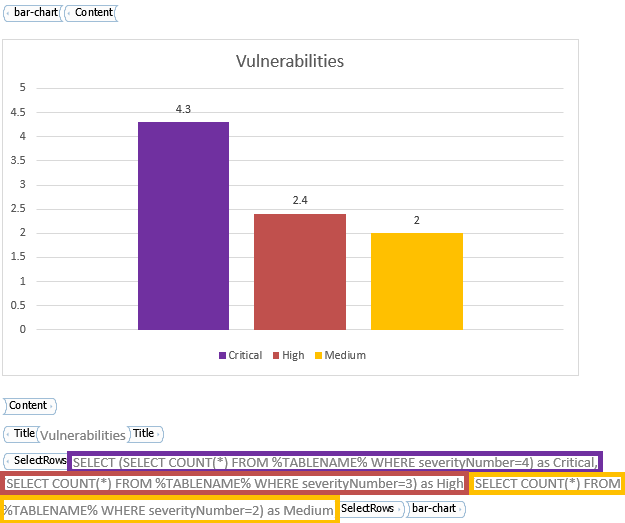
- Setting Up the SQLite Query: Within the ‘Bar-chart’ Content Control, locate a sub-control named ‘SelectRows’. It’s important to ensure that this query returns exactly one row of data, as each column in this row will correspond to a separate bar in the bar graph.
Step 3: Customize the Charts’s Appearance
- Styling the Chart: Customize the look of your bar chart to fit the overall style and theme of your report. This can involve changing bar colors, adjusting chart size for clarity, and formatting the text labels for each axis.
- Addressing the Color Bug: Currently, there is a known issue in NamicSoft where all bars in the chart default to the same color as the first bar. Until this bug is resolved, you will need to manually adjust the colors of the bars after the template has been generated.


